Financials

Target Asset Allocation
Equities – 65.0%
(includes US Large and Small Cap, non-US equity, and private equity)
Fixed Income – 20.0%
Diversifying Strategies – 7.0%
Real Assets – 8.0%
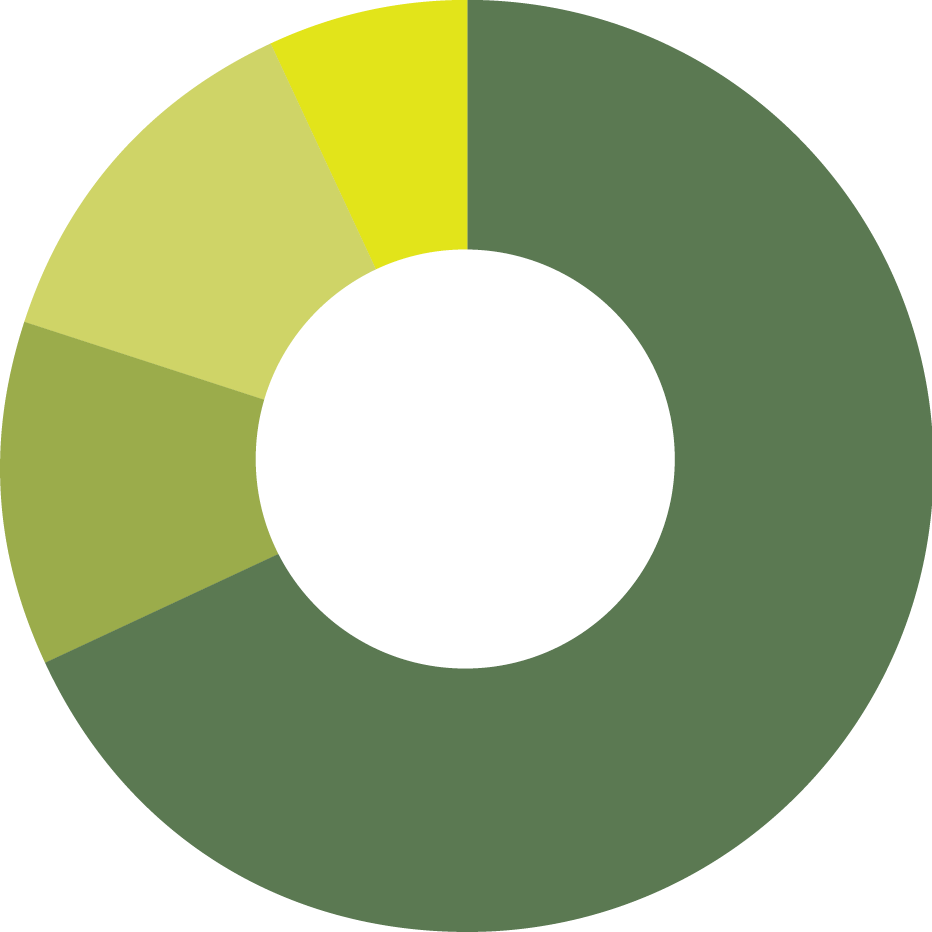
Actual Asset Allocation
Equities – 65.5%
Fixed Income – 19.8%
Diversifying Strategies – 5.7%
Real Assets – 9.0%
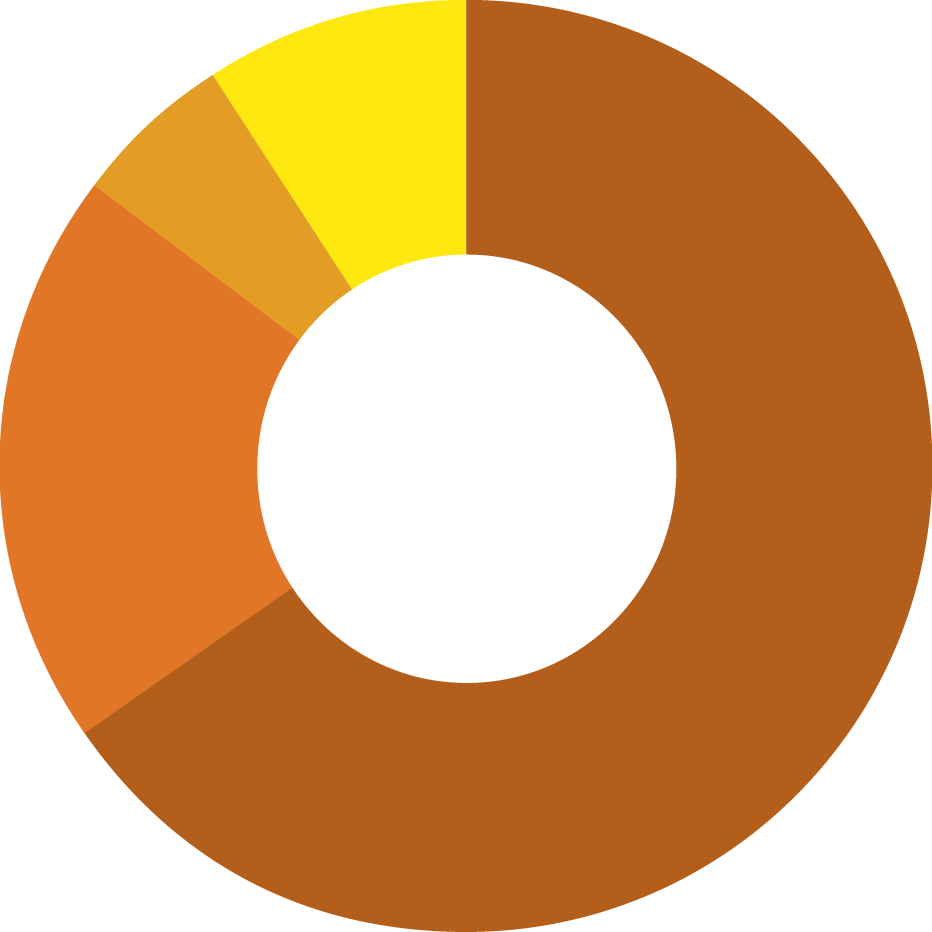
Allocation of Expenses
Grants – 68.0%
Program Expenses – 12.1%
Admin Expenses – 13.1%
Non-Qualifying Expenses – 6.8%
Growth in Total Assets
Fiscal Year
Total Assets
FY14
$449,000,000
FY15
$417,000,000
FY16
$422,000,000
FY17
$473,000,000
FY18
$431,000,000
FY19
$476,000,000
FY20
$513,000,000
FY21
$566,000,000
FY22
$484,000,000
FY23
$528,546,911
Impact Investing

Learn more by visiting our Impact Investing page.